 Last weekend, Thomas and Maxime drove down from Toulouse, France to Girona, Spain to attend the 4th annual OpenStreetMap conference: the State of the Map 2010, and give a talk on MapOSMatic.
For both of us, it was the first time we attended an OpenStreetMap conference, or even a GIS-centric conference, and it was a very good surprise to find such a welcoming, friendly and knowledgable community! In the just two days of the conference we attended (saturday and sunday), we saw numerous interesting talks. The fact that we’re both new to GIS-related stuff meant that every talk allowed to learn a new thing, discover a new project, and convince even more ourselves that OpenStreetMap is an awesome project and that GIS is a very interesting area. Amongst all the talks, here are a few we particularly liked :
- OSM without delay, by Matt Amos. It was a talk about the fairly new minutely diffs, which allow anyone to keep its copy of the OpenStreetMap database in sync with the official database with a delay as short as one minute. As Matt said, this is quite important, as it allows your users to see their edits almost immediatly available in your OpenStreetMap-based applications. For example, MapOSMatic currently uses daily diffs, which means that anyone has to wait up to 24 hours before the changes made to OpenStreetMap are actually visible in MapOSMatic. Matt then talked about the OSM watch list, a service that allows to be notified of changes happening in areas you would like to watch in OpenStreetMap. As the amount of contributions to OpenStreetMap increases, being able to track what is changing in a particular area is becoming more and more important. Matt Amos has already made his slides available.
- Tuning the Mapnik rendering chain, by Frederik Ramm. Frederik works at Geofabrik, which amongst others, is the company that offers regional extracts of the OSM database that are very useful for those who want to experiment with OSM data without having to pay the price of loading the huge world database. Importing the world database and keeping it up-to-date with daily diffs is a very resource-consuming process, and Frederik made various experiments to understand which configurations perform better than others. The purpose of this talk was to report the results of all these tests. He tested full planet important on a high-end machine (16 cores, 48 GB of RAM) with various I/O subsystems: SSD, normal SATA drive, fast hard drive, RAID array. He also tested various configurations options of osm2pgsql and PostgreSQL/PostGIS. His main conclusion is that you need a lot of RAM, and that some parts of the import process would benefit from being multithreaded or optimized (such as the XML parsing) as they are CPU-bound rather than I/O-bound. All the details and resulsts are available in his slides.
- Tag Central, by David Earl, was about a proposal to have a mechanism to describe all the tags used for OSM data, so that OSM editors have a reference to look at to know what should be the tags for a particular feature of OSM data (for example maxspeed=… for highways).

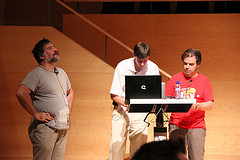
David Earl getting on stage for his talk
- Can we look at your polygons?, by Peter Mooney, was an analysis of many polygons used to represent areas such as forests, lakes, etc. He compared the surface of these polygons with the number of points used to describe them, to show that some polygons are defined with a high-level of precision while others are very imprecise. It was interesting to see that OSM contributors are looking closely at the quality of the data and trying to extract lessons for the future.
- Corine and BMO import, by Émilie Laffray, was a report about two large data imports that occurred in France: Corine Land Cover data, and Brest Métropole Océane road data. Émilie described in detail the process, both from a technical point of view and from a community point of view. She stressed out the fact that getting the community involved and aware of what’s happening when an import is done is very important. This talk was a good illustration of how State of the Map is the opportunity for countries to share their experiences in working with OSM data and contributors, so that other countries can benefit from those past experiences.
- What I’d like to do with Mapnik, by Steve Chilton, was a presentation on the next challenges for Mapnik. It allowed to discover how complicated a map rendering software such as Mapnik can be, and how hard it is to find the good algorithms and heuristics to draw all the map elements in a nice and readable way.
- What I learned from making a real map on real paper for real people and real money, by David Earl, was a presentation about a project David did for Wisbech, a city in the UK. David was hired to produce a cycle map of the area, based on OpenStreetMap data. In some ways, his project had similarities with what MapOSMatic does: producing a city map, overlayed by a grid, with a street index. However, as the goal was to produce a finished product, David used a more manual approach : many tiny details needed to be fixed in the map rendering to make it really usable. David decided not to use Mapnik and instead wrote his own rendering software that generates Postscript from OSM data. He came with printed, final versions of the product, which are very impressive in terms of quality.
- Dozens of lightning talks. Throughout the two days of conferences, several slots were dedicated to lightning talks, and it was a very good idea. As each talk is only 5 minutes long, it means that in just an hour of lightning talks, you can hear about many, many projects, ideas or experiences. Amongst the interesting ones, we remember the one about mapping power installations (power lines, power towers with their identifiers, etc.), the one about MongOSM, a tool to use MongoDB to store OSM data, another one about mapping house numbers, several about various mapping tools, etc.
The slides of all the talks should progressively be made available at http://wiki.openstreetmap.org/wiki/State_Of_The_Map_2010, and the videos should also be available some day on the project’s wiki.

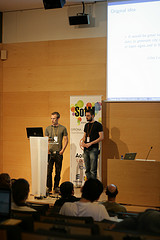
Maxime and Thomas giving the MapOSMatic talk
On Sunday, we gave our talk on MapOSMatic in front of a 100-people audience (see MapOSMatic slides for State Of The Map 2010). We can say without hesitation that our project was very well received by the community: we’ve been interrupted several times during the talk by rounds of applause! Within the allocated 15 minutes, we presented the small history of MapOSMatic, the unusual development model we follow, the features of MapOSMatic, a walk-through of its interface, technical details about the software and our infrastructure, issues we face using OSM data for MapOSMatic, and finally future directions. After the talk and generally during the whole conference, we met several participants that told us how much they liked MapOSMatic. Discussing with OSM contributors also allowed us to gather what the most-wanted features for MapOSMatic are: more flexibility in the printing ratio, generation of booklets instead of posters and customization of the map rendering.
Participating in this State Of The Map conference therefore gave us a huge motivation boost to continue working on the project, which we will do during the next hackfest at the beginning of August near Toulouse, France. We definitely hope to have new features to present for the next State of the Map edition!


 In addition to
  State Of The Map