As we announced during our talk at State Of The Map, we are currently having a hackfest during which we’ll try to improve MapOSMatic in various directions until Sunday. After a startup phase yesterday evening with the arrival of all participants and the preparation of working setups of MapOSMatic/OCitySMap, the hard work has started today.
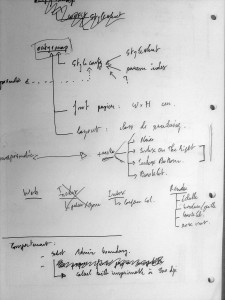
We’ve spent the whole morning discussing the design of the improvements to MapOSMatic we’d like to implement during this hackfest. The following topics have been discussed :
- Better adaptation of MapOSMatic results to printed maps, in terms of format. To solve this, what we intend to do is that once the user has selected a geographic area (either from bounding box or through the name of an administrative boundary), we’ll offer a selection of suitable paper sizes, from a list of standard formats. Obviously, the range of paper formats available for a given area will be limited by the size of the area: the bigger the area is, the larger the paper size will have to be. Once we know the paper format choosen by the user, we will adjust the geographic area to fill the complete paper area, in a way that of course guarantees that the complete originally selected area is visible. If a lot of paper space is available compared to the size of the geographic area, we might even increase the zoom level to provide additional map details.
- Customization of the rendering layout. Instead of our current single layout with the map on one side and the street index on the other side, with the same size as the map, we will offer three rendering layouts : a plain layout (just the map, no index), a map with an index (the index being on the same side as the map) and a booklet layout (where the map and the index is split in several pages, for easy printing on A5/A4/US letter paper formats)
- Customization of the stylesheets. To begin with this, we will just provide a choice between a pre-selected set of Mapnik stylesheets. Offering the ability to use a custom Mapnik stylesheet is relatively complex in terms of security issues (Mapnik stylesheets contain SQL requests), so we decided to keep the choice inside a limited list. Of course, we’d like to see people contributing additional Mapnik stylesheets.
After the design discussion, we’ve written a few Python lines of code to define the new interface between MapOSMatic (the web frontend) and OCitySMap (the rendering backend), so that different sub-teams could work separately on these modules. And then, the implementation work started, in different areas :
- Major refactoring of OCitySMap, to prepare the addition of the new features. The OCitySMap code, while relatively short, was pretty ugly in various areas, so a refactoring was more than needed. Hopefully, it should allow us in the next few days to add features without too much pain

- Work on the OpenLayers slippy map to improve the user experience for the selection of the geographic area. Now, the full area visible on the slippy map will not be area selected by rendering. Instead, the user has to draw a rectangle of the area to render, and this rectangle remains visible on the map so that the user can adjust the area as needed.
- Work on the creation map process in the MapOSMatic web front-end by switching to a wizard-like procedure. This is needed since we will now have additional steps to configure the different aspects of the map before rendering it. This involves quite a bit of Javascript, JQuery, CSS and OpenLayers…
- Experimentation on the ReportLab PDF rendering library to generate the index, as it would probably be much easier to use than our manual index rendering code directly using Pango and Cairo.
More about our work tomorrow !
