PostGIS database down

January 16th, 2012

The server hosting our PostGIS database, gracefully made available to us by the FSF France, is currently undergoing maintenance. This unfortunately means we can’t process any maps at the moment, but we’ve been assured that everything is put in motion to bring this server back online as soon as possible, hopefully in the next couple of days.

We’ll keep you updated on the status of the database server; in the meantime new renderings will be queued up and the failed renderings will be rescheduled to make sure all the requested maps are generated. It does unfortunately also means these renderings will represent outdated geographical data while the PostGIS database replication catches up.

MapOSMatic database down

May 3rd, 2011

As you may have noticed, recent renderings have been failing on MapOSMatic. This is because our main PostGIS database is currently down. We are working on getting more information on the outage from the nice folks at FSF France who gracefully allow us to host our database on one of their servers.

All the jobs that failed because of the outage have been requeued, so they’ll be rendered as soon as the database is back up and we can restart the processing queue.

Hang in there!

edit: we’re back! The database server is back online and the rendering pipeline has been restarted and is now catching up on the queue. Thanks for your patience!

MapOSMatic presentation in Rennes, France

February 21st, 2011

David Mentré, one of the developers of MapOSMatic, will give a presentation of the project in Rennes, France on March, 7th at 6:30 PM at the new digital space « La Cantine Rennaise », Les Champs Libres, 46 boulevard Magenta, 35000 Rennes. The presentation will take place in French.

For more details, see http://www.lacantine-rennes.net/prog/?event_id=50

MapOSMatic is back!

October 12th, 2010

The past couple of weeks have unfortunately been very difficult for MapOSMatic. The rapid growth of the OpenStreetMap database with the recent massive data imports drastically reduced the time we thought we had to migrate away from our server that we knew would not be able to host MapOSMatic and the full planet database for long. And so it happened, our disk was full.

We started by removing the previous renderings, more and more aggressively, to make room for the database updates and a few renderings, to maintain the service running. But this could not last forever, and we ended up having to stop the rendering queue.

Thanks to the FSF France, we were given access to a powerful server that could temporarily host the OSM planet database until we can find a more perennial solution. In the past two weeks, I spent as much time as I could (which was not much since I was relocating to the United States at the same time) setting up a PostGIS database on this new server. This database is now operational, and currently catching-up its replication lag from the latest OpenStreetMap data.

MapOSMatic is now hosted on two distinct servers. The first one is provided by Enix, a French hosting company. It hosts the rendering queue, the web service, this blog, the wiki, the statistics and of course the rendering results. With 1TB of disk storage available, we have enough room to keep a lot more renderings, so your maps will be available for a greater length of time (of course you still need to regenerate them to get up-to-date data). The second server, from the FSF France, hosts solely the PostGIS database, with one task only: keeping it as up-to-date as possible. For now, we are still on a daily updates schedule, but I’m working on moving to more frequent updates, eventually up to minutely updates.

With our apologies for the service downtime, we hope you’re as happy as we are to see MapOSMatic back on its feet again! All the rendering requests submitted while the queue was halted are now being processed, so don’t hesitate to go search for the maps you recently requested, they are probably available now! And stay tuned for some more updates, the new version of the MapOSMatic rendering engine is just around the corner…

New temporary hosting

October 7th, 2010

Thanks to the FSF France and especially Laurent Guerby, we have found a new temporary hosting for MapOSMatic, on a monster machine (64 GB of RAM, 24 cores and lots of storage space). Maxime has been working this week on setting up this new machine, and he hopes to be able to restart the MapOSMatic operations next week.

However, this hosting solution is only temporary, as the server is shared with many other users and may be dedicated to other purposes in the future. We have received several proposals of donations, so we are currently discussing with existing organizations to see if they could become the legal entity that receives such donations and uses them to pay the hosting needed for MapOSMatic. We will of course post more details on this blog as those discussions progress.

Thank you for your support!

MapOSMatic rendering queue frozen

September 29th, 2010

The new server on which we expected to migrate the MapOSMatic service proved to be less powerful than our existing system, preventing us from migrating the service. The increase of OSM data has now completely filled the 250 GB hard-drive of our current server, so we had to disable the rendering of maps. Tonight, we got access to a new, powerful enough server, so we hope to put MapOSMatic back online in one or two weeks.

However, this new hosting will not be usable on the long-term, it is only a temporary solution. We are still looking for a long-term solution to host MapOSMatic, on a machine with at least 4 GB of RAM (the more RAM the better), 2 cores and 1 TB of disk. We have received several proposals of donations, but we unfortunately do not have the legal entity to receive them for the moment. We are also considering creating such an entity, or hosting the MapOSMatic project under the umbrella of an existing entity.

If your company wants to sponsor the hosting for MapOSMatic, we’ll be very happy to show the logo of your company on the MapOSMatic frontpage, as well as a more detailed description of your company in the About page. Do not hesitate to contact us at [email protected].

Hackfest MapOSMatic 2010, day 2

August 5th, 2010
Maxime working on his TypeMatrix Dvorak keyboard, editing OCitySMap code with vim

Maxime working on his TypeMatrix Dvorak keyboard, editing OCitySMap code with vim

We’re early in the morning of day 3 of this MapOSMatic hackfest, everybody is still asleep, so it’s time to do a little wrap-up on what has been done yesterday :

  • Maxime and David have continued their work on refactoring the OCitySMap module and extending it to support the new level of map customization that we will offer. So far, the map generation is working again, together with the overlayed grid, with a much, much better Python code, that will hopefully allow us and other contributors, to add more features more easily than in the past. Today, they will continue their refactoring work with the street index generation.
  • Gaël has continued and completed his work on the slippy map user experience improvements. The user now draws a rectangle to define the area to be rendered, and we immediately check whether the area is too big to be rendered by MapOSMatic.
  • Éric has continued his experimentation of the ReportLab PDF library and its Platypus page layout engine, but finally came to the conclusion that while the automatic page layout engine is nice, it doesn’t provide enough control on the layout to generate a street index similar to the one we’re doing today.
  • Pierre has worked on different small but important improvements:
    • in the page corresponding to a particular rendering, add a link to the corresponding location in OpenStreetMap so that an user can easily check the current status of a particular area
    • in the results provided by our Nominatim proxy, add information about the size of each administrative boundary. This will allow us to no longer limit the selection of administrative boundaries to level 8 boundaries while still preventing the user from rendering too large areas.
  • I’ve worked on finishing the Map Creation Wizard that allows to select the different parameters for a map. It is now feature-complete, the code has been cleaned up, even though it still need some more polishing, especially on the presentation side, which will done later by Maxime, our CSS expert.

Last, but not least, the import of the planet database has completed on our new server that should start hosting the official MapOSMatic.org website in a couple of days or weeks. With a better CPU, two times the amount of RAM and four times the amount of disk of the previous server, it should provide a more scalable hosting solution for the coming months.

Today, work will continue with a first integration of the different improvements, the rest of the OCitySMap refactoring, experiments on Cairo for the booklet generation, improvements on the street index generation, experiments on rendering Wikipedia pages, final details on the wizard, and more.

Stay tuned for tomorrow updates !

Hackfest MapOSMatic 2010, day 1

August 4th, 2010
Notes on new MapOSMatic features

Notes on new MapOSMatic features

As we announced during our talk at State Of The Map, we are currently having a hackfest during which we’ll try to improve MapOSMatic in various directions until Sunday. After a startup phase yesterday evening with the arrival of all participants and the preparation of working setups of MapOSMatic/OCitySMap, the hard work has started today.

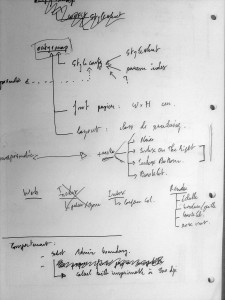
We’ve spent the whole morning discussing the design of the improvements to MapOSMatic we’d like to implement during this hackfest. The following topics have been discussed :

  • Better adaptation of MapOSMatic results to printed maps, in terms of format. To solve this, what we intend to do is that once the user has selected a geographic area (either from bounding box or through the name of an administrative boundary), we’ll offer a selection of suitable paper sizes, from a list of standard formats. Obviously, the range of paper formats available for a given area will be limited by the size of the area: the bigger the area is, the larger the paper size will have to be. Once we know the paper format choosen by the user, we will adjust the geographic area to fill the complete paper area, in a way that of course guarantees that the complete originally selected area is visible. If a lot of paper space is available compared to the size of the geographic area, we might even increase the zoom level to provide additional map details.
  • Customization of the rendering layout. Instead of our current single layout with the map on one side and the street index on the other side, with the same size as the map, we will offer three rendering layouts : a plain layout (just the map, no index), a map with an index (the index being on the same side as the map) and a booklet layout (where the map and the index is split in several pages, for easy printing on A5/A4/US letter paper formats)
  • Customization of the stylesheets. To begin with this, we will just provide a choice between a pre-selected set of Mapnik stylesheets. Offering the ability to use a custom Mapnik stylesheet is relatively complex in terms of security issues (Mapnik stylesheets contain SQL requests), so we decided to keep the choice inside a limited list. Of course, we’d like to see people contributing additional Mapnik stylesheets.

After the design discussion, we’ve written a few Python lines of code to define the new interface between MapOSMatic (the web frontend) and OCitySMap (the rendering backend), so that different sub-teams could work separately on these modules. And then, the implementation work started, in different areas :

  • Major refactoring of OCitySMap, to prepare the addition of the new features. The OCitySMap code, while relatively short, was pretty ugly in various areas, so a refactoring was more than needed. Hopefully, it should allow us in the next few days to add features without too much pain :-)
  • Work on the OpenLayers slippy map to improve the user experience for the selection of the geographic area. Now, the full area visible on the slippy map will not be area selected by rendering. Instead, the user has to draw a rectangle of the area to render, and this rectangle remains visible on the map so that the user can adjust the area as needed.
  • Work on the creation map process in the MapOSMatic web front-end by switching to a wizard-like procedure. This is needed since we will now have additional steps to configure the different aspects of the map before rendering it. This involves quite a bit of Javascript, JQuery, CSS and OpenLayers…
  • Experimentation on the ReportLab PDF rendering library to generate the index, as it would probably be much easier to use than our manual index rendering code directly using Pango and Cairo.

More about our work tomorrow !

Back from the State of the Map 2010

July 14th, 2010

Last weekend, Thomas and Maxime drove down from Toulouse, France to Girona, Spain to attend the 4th annual OpenStreetMap conference: the State of the Map 2010, and give a talk on MapOSMatic.

For both of us, it was the first time we attended an OpenStreetMap conference, or even a GIS-centric conference, and it was a very good surprise to find such a welcoming, friendly and knowledgable community! In the just two days of the conference we attended (saturday and sunday), we saw numerous interesting talks. The fact that we’re both new to GIS-related stuff meant that every talk allowed to learn a new thing, discover a new project, and convince even more ourselves that OpenStreetMap is an awesome project and that GIS is a very interesting area. Amongst all the talks, here are a few we particularly liked :

  • OSM without delay, by Matt Amos. It was a talk about the fairly new minutely diffs, which allow anyone to keep its copy of the OpenStreetMap database in sync with the official database with a delay as short as one minute. As Matt said, this is quite important, as it allows your users to see their edits almost immediatly available in your OpenStreetMap-based applications. For example, MapOSMatic currently uses daily diffs, which means that anyone has to wait up to 24 hours before the changes made to OpenStreetMap are actually visible in MapOSMatic. Matt then talked about the OSM watch list, a service that allows to be notified of changes happening in areas you would like to watch in OpenStreetMap. As the amount of contributions to OpenStreetMap increases, being able to track what is changing in a particular area is becoming more and more important. Matt Amos has already made his slides available.
  • Tuning the Mapnik rendering chain, by Frederik Ramm. Frederik works at Geofabrik, which amongst others, is the company that offers regional extracts of the OSM database that are very useful for those who want to experiment with OSM data without having to pay the price of loading the huge world database. Importing the world database and keeping it up-to-date with daily diffs is a very resource-consuming process, and Frederik made various experiments to understand which configurations perform better than others. The purpose of this talk was to report the results of all these tests. He tested full planet important on a high-end machine (16 cores, 48 GB of RAM) with various I/O subsystems: SSD, normal SATA drive, fast hard drive, RAID array. He also tested various configurations options of osm2pgsql and PostgreSQL/PostGIS. His main conclusion is that you need a lot of RAM, and that some parts of the import process would benefit from being multithreaded or optimized (such as the XML parsing) as they are CPU-bound rather than I/O-bound. All the details and resulsts are available in his slides.
  • Tag Central, by David Earl, was about a proposal to have a mechanism to describe all the tags used for OSM data, so that OSM editors have a reference to look at to know what should be the tags for a particular feature of OSM data (for example maxspeed=… for highways).
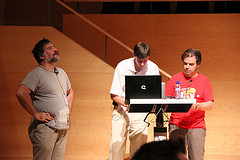
    David Earl getting on stage for his talk

    David Earl getting on stage for his talk

  • Can we look at your polygons?, by Peter Mooney, was an analysis of many polygons used to represent areas such as forests, lakes, etc. He compared the surface of these polygons with the number of points used to describe them, to show that some polygons are defined with a high-level of precision while others are very imprecise. It was interesting to see that OSM contributors are looking closely at the quality of the data and trying to extract lessons for the future.
  • Corine and BMO import, by Émilie Laffray, was a report about two large data imports that occurred in France: Corine Land Cover data, and Brest Métropole Océane road data. Émilie described in detail the process, both from a technical point of view and from a community point of view. She stressed out the fact that getting the community involved and aware of what’s happening when an import is done is very important. This talk was a good illustration of how State of the Map is the opportunity for countries to share their experiences in working with OSM data and contributors, so that other countries can benefit from those past experiences.
  • What I’d like to do with Mapnik, by Steve Chilton, was a presentation on the next challenges for Mapnik. It allowed to discover how complicated a map rendering software such as Mapnik can be, and how hard it is to find the good algorithms and heuristics to draw all the map elements in a nice and readable way.
  • What I learned from making a real map on real paper for real people and real money, by David Earl, was a presentation about a project David did for Wisbech, a city in the UK. David was hired to produce a cycle map of the area, based on OpenStreetMap data. In some ways, his project had similarities with what MapOSMatic does: producing a city map, overlayed by a grid, with a street index. However, as the goal was to produce a finished product, David used a more manual approach : many tiny details needed to be fixed in the map rendering to make it really usable. David decided not to use Mapnik and instead wrote his own rendering software that generates Postscript from OSM data. He came with printed, final versions of the product, which are very impressive in terms of quality.
  • Dozens of lightning talks. Throughout the two days of conferences, several slots were dedicated to lightning talks, and it was a very good idea. As each talk is only 5 minutes long, it means that in just an hour of lightning talks, you can hear about many, many projects, ideas or experiences. Amongst the interesting ones, we remember the one about mapping power installations (power lines, power towers with their identifiers, etc.), the one about MongOSM, a tool to use MongoDB to store OSM data, another one about mapping house numbers, several about various mapping tools, etc.

The slides of all the talks should progressively be made available at http://wiki.openstreetmap.org/wiki/State_Of_The_Map_2010, and the videos should also be available some day on the project’s wiki.

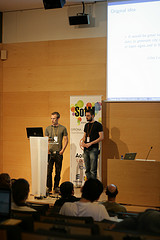
Maxime and Thomas giving the MapOSMatic talk

Maxime and Thomas giving the MapOSMatic talk

On Sunday, we gave our talk on MapOSMatic in front of a 100-people audience (see MapOSMatic slides for State Of The Map 2010). We can say without hesitation that our project was very well received by the community: we’ve been interrupted several times during the talk by rounds of applause! Within the allocated 15 minutes, we presented the small history of MapOSMatic, the unusual development model we follow, the features of MapOSMatic, a walk-through of its interface, technical details about the software and our infrastructure, issues we face using OSM data for MapOSMatic, and finally future directions. After the talk and generally during the whole conference, we met several participants that told us how much they liked MapOSMatic. Discussing with OSM contributors also allowed us to gather what the most-wanted features for MapOSMatic are: more flexibility in the printing ratio, generation of booklets instead of posters and customization of the map rendering.

Participating in this State Of The Map conference therefore gave us a huge motivation boost to continue working on the project, which we will do during the next hackfest at the beginning of August near Toulouse, France. We definitely hope to have new features to present for the next State of the Map edition!

MapOSMatic talk at Libre Software Meeting, France

May 10th, 2010

In addition to the talk about MapOSMatic Maxime and I will be giving at State of the Map, I will also be giving a talk about MapOSMatic during the Libre Software Meeting, a large free software conference that takes place from July, 6th to July, 11th in Bordeaux, France, right before SOTM.

Recent updates in MapOSMatic

March 20th, 2010
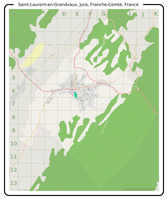
Saint Laurent en Grandvaux, Jura, Franche Comté, France

Saint Laurent en Grandvaux, Jura, Franche Comté, France

MapOSMatic recently passed an important milestone in its history. A few weeks ago, we served our 10,000th rendered map (Saint-Laurent-en-Grandvaux, Jura, France) ! We are very pleased with this accomplishment and feel it is important for us to continue improving the MapOSMatic service for our users. We are working on several objectives in parallel:

  • improving the user experience on the website, adding new features and more translations;
  • reducing the rendering latency to produce maps faster for our users;
  • improving the maps and indexes themselves.

Today we rolled out on MapOSMatic a few changes that have been brewing and undergoing extended testing on our development setup, and as I write this post I am pleased to see that we are making good progress on these three main directions.

First and foremost, I think the most important update today comes from the addition of a Spanish translation of the MapOSMatic website (and the corresponding capability to generate maps and indexes internationalized for Spanish-speaking countries), contributed by Julio Costa Zambelli, Sebastian Borgwardt and Jean-Guilhem Cailton. We hope the availability of MapOSMatic in Spanish will help the Chile earthquake disaster response teams.

Next, we restored the bounding-box area input fields for specifying an exact zone to render by the coordinates of its top-left and bottom-right corners. We also added a new feature to the slippy map: by maintaining the Control key pressed, you can draw a rectangle directly on the map to precisely define the limits of the area you wish to render!

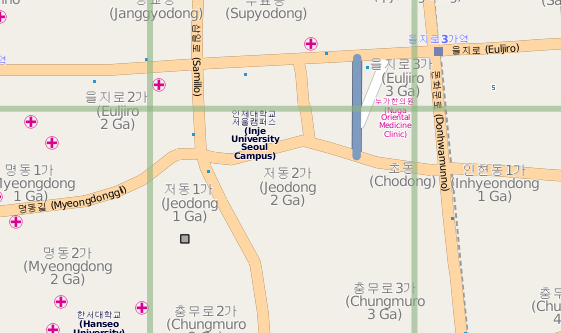
Small part of Seoul, South Korea

Small part of Seoul, South Korea

This update allows integrates better support for some languages :

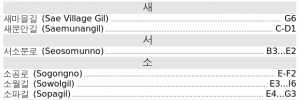
  • The index of the streets and amenities, as well as the map and index titles are now rendered through the Pango library, which allows to correctly render Arabic, Korean or Japanese characters
  • The index is now rendered right-to-left for RTL languages such as arabic. The first column is on the right, the last column on the left, the street names are on the right while the square locations are on the left.
  • We also fixed a font problem with our Mapnik installation allowing for rendering of non-latin characters in the maps as well.
Small part of the index for Seoul, South Korea

Small part of the index for Seoul, South Korea

And finally, as advertised in a previous post about MapOSMatic improvements, we are now using a new version of the rendering daemon (the software in charge of processing the rendering requests queue and creating the maps and indexes). This new daemon lays the groundwork for future concurrent rendering and rendering jobs distribution which will help reducing the rendering latency, when completed. It also has better management of obsolete renderings, with the direct impact of no longer listing hundreds, if not thousands of maps we no longer have the rendered files for.

I would like to conclude this post by thanking, again, all the amazing contributors to MapOSMatic for their continuous feedback, ideas, bug reports and their celerity in providing translations updates when we add new features to MapOSMatic!

MapOSMatic talk proposal submitted for SOTM 2010

March 15th, 2010

State Of The MapState Of The Map is the yearly conference entirely dedicated to OpenStreetMap and is therefore the most important conference for the OpenStreetMap community. The 2010 edition will take place in Girona, Spain, from July, 9th to July 11th.

Maxime Petazzoni and I have submitted a talk about the MapOSMatic project, in the name of all the MapOSMatic developers. Our talk is entitled MapOSMatic: city maps for the masses, and here the abstract we’ve submitted :

Launched in september 2009, MapOSMatic is a web service that lets anyone create a map for any city in the world, based on OpenStreetMap data. A grid overlay is added to the map, along with the corresponding index of streets and amenities for the city, giving a ready-to-be-printed map. These maps can for example be used in information panels in cities, or, after folding, as traditional city maps.

As of march 2010, this service has generated over 10,000 maps, and has been adapted for French, English, German, Italian, Catalan, Russian, Arabic, Portuguese, Dutch, Crotian, Polish and Spanish.

Through our talk, we would like to highlight MapOSMatic history and features, give details on its technical implementation, describe the future directions we would like to take, and detail how the OpenStreetMap project as a whole could be improved to help projects such as MapOSMatic.

The presentation will be given by Maxime and Thomas Petazzoni, two geek brothers part of the team of french hackers who created and developed MapOSMatic. Maxime and Thomas both work in the embedded Linux area, respectively for Montavista Software, LLC and Free Electrons.

We hope that our proposal will be accepted so that we will be able to present the project to the wider OpenStreetMap community, gather ideas for improvements, and discuss how the OpenStreetMap project itself could be modified to better suit the needs of projects such as MapOSMatic. We’ll of course put an update on this blog as soon as we have the answer from the program comittee.

Two months of MapOSMatic improvements

March 8th, 2010

Since the december 2009 hackfest (reported here, here and here) and the official announcement of the improvements early january 2010, MapOSMatic has seen a sustained flow of interesting improvements. This post compiles the most important improvements that we have done recently, and some details on future improvements.

OcitySMap

Support for other countries has been added to OcitySMap, the Python module that actually generates the maps and the indexes. This support allows OcitySMap to generate correct indexes for other countries, by transforming street names such as “Calle de la Vida” into “Vida (Calle de la)”. This was made possible through the major re-organization of OcitySMap for internalization that took place during the december 2009 hackfest. So far, we have support for french, italian, spanish, catalan, brasilian portuguese, arabic, russian, dutch, crotian and polish, thanks to many contributors !

From a coding point of view, OcitySMap now uses the psycopg2 Python module to query the PostgreSQL database instead of pygresql. We made this change because Django, the Web framework that we use for MapOSMatic, already uses psycopg2. Using the same Python module to query the PostgreSQL database sounded like a logical choice.

MapOSMatic

MapOSMatic, the web front-end for OcitySMap, has also seen a large number of improvements. First, many translations have been added: german, italian, catalan, russian, arabic, brasilian portuguese, crotian, polish and dutch. For the Arabic translation, we have added Right-to-Left support in our web site design. Again, all the translations come from new contributors to the project.

The website has also been completely re-designed :

  • A brand new CSS, with a much cleaner design
  • The map creation page is now separate from the homepage, for more clarity
  • The selector for the city name in the map creation page now provides an auto-suggestion mechanism
  • The job and maps page have been completely re-designed, with a better design than the old table-based approach. The maps are now classified by first letter, and a search engine allows to quickly find existing maps.
  • A RSS feed has been added to keep track of map renderings taking place on MapOSMatic.org.

See Maxime Petazzoni’s blog post for details on these design improvements.

Coming improvements

We have already implemented further improvements, that are currently being tested on our development server :

  • A new rendering daemon. When a map request is entered on MapOSMatic, the map rendering doesn’t take place synchronously, since it is a quite consuming work. Map rendering requests are processed asynchronously, one after the other, through a daemon called maposmaticd. This daemon has been completely rewritten to use more Python-ic approaches, to better support timeouts (renderings taking too much time) and in the future to support parallel renderings.
  • Use of Pango for text rendering. Until now, OcitySMap was directly using Cairo for rendering text in the street index. While this was working fine for latin characters, it didn’t work for arabic or korean characters (and probably other non-latin characters). Therefore, we have rewritten the code that generates the index to use Pango on top of Cairo, so that all characters are properly rendered. This change needs a little more work but should be ready for production soon.

We have also identified one of the major reasons for which the rendering requests are sometimes so long to process. One of our geographic SQL query is taking a very long time, due to the absence of optimization. We are working on this issue with PostGIS/PostgreSQL experts, and hope to get down from 4 minutes 38 seconds for getting the list of streets for Toulouse to something around 3.2 seconds. As you can expect, we are really looking forward to making these new changes available to the MapOSMatic community!

Major improvements to MapOSMatic

January 4th, 2010

We have just sent the following announcement to OpenStreetMap lists, officially announcing the improvements made to MapOSMatic during the latest hackfest.


As a new year’s present, the MapOSMatic team is proud to announce that a new version of the maposmatic.org website has been put online, with major improvements over the initial version announced in September 2009.

For the record, MapOSMatic is a website that allows to generate city maps from OpenStreetMap data. Each map is divided into squares to easily find streets and is delivered with the corresponding street index.

The new MapOSMatic provides the following improvements :

  • Support for the whole world. Any location in the world can now be rendered on maposmatic.org.
  • OpenStreetMap database updated daily. Until now, the database had never been updated since the service was started in September 2009. Now, the geographic database used to render the maps is updated daily, providing maps with the latest contributions to OpenStreetMap. Each map contains the date at which it was generated.
  • Better city search engine. Thanks to Nominatim, we now provide a search engine that allows to find cities in a much more usable way: cities with the same name can be distinguished and the search works even when the city name is not completely correct.
  • Support for other languages. A few parts of the map rendering process is language-dependent and we now have the infrastructure to use language-dependent code. For the moment, we support English, French and Italian, but we are waiting for your contributions to support other languages. The website has also been translated to German and Italian.
  • Amenities in the index. In addition to the streets, we have added important amenities to the index: schools, town hall, post offices, places of worship, etc.

All these improvements are available now on http://www.maposmatic.org

You can follow the progress and improvements of MapOSMatic on our blog at http://news.maposmatic.org. MapOSMatic is of course free software, you can fetch its source code and contribute to the project, see http://savannah.nongnu.org/projects/maposmatic/.

Do not hesitate to send us your feedback, comments, suggestions and contributions to [email protected]

Cheers,

The MapOSMatic team.


MapOSMatic hackfest, day 3

December 22nd, 2009

Yesterday was day 3 of the hackfest, and we of course spent our day working on MapOSMatic.

  • Support for amenities in index has been added. Now, in addition to the streets, you have the location of the town hall, police station and other public buildings, the schools, universities and other education buildings, and the places of worship. More improvements are needed in this area (translation of headings, support for amenities represented by polygons, fix incorrect grouping), but the general infrastructure is in place.
  • The main form to select the city has been further improved, with bug fixes, improved usability, etc. Said like this, it doesn’t sound like a big deal, but all this stuff is written in Javascript using the JQuery library and requires careful fine-tuning to be working. We easily spend a day on the same 20 lines of Javascript.
  • The language selection has been improved, with all french-speaking countries and all english-speaking countries added (we’re waiting for your contributions for other languages). The list of languages available is now automatically reduced to the languages spoken in the country in which the selected city is. For multi-lingual countries like Belgium, we have no way to know if the selected city is in the french-speaking area, the dutch-speaking area or the german-speaking area. Therefore, it is up to the user to choose between these languages. This selection changes how the streets are sorted and the list of prefixes that we consider before sorting.
  • The slippy map based on OpenLayers is now loaded only if bounding box mode is used. This allows a much quicker loading of the MapOSMatic homepage.
  • We have improved our server infrastructure to regularly update the coast lines, which are coming from a difference source than the planet OSM xml file. It allowed to fix rendering problems in island where we had ugly coast lines. These informations are now updated once a week.

We’re now starting day 4 of the hackfest. We will soon send out a notification to beta-testers so that they can test all these new features and report their comments and bugs.